Portugal Tops the EU for House Price Growth Again, With a 16.5 Percent Annual Rise Against 4.7 Percent Across the Union
Homes in Portugal cost 16.5 percent more in the second quarter of 2026 than a year earlier, the fastest rise in the EU for a second quarter running, Eurostat figures show. The EU average was 4.7 percent; Portuguese prices have roughly tripled since 2015.
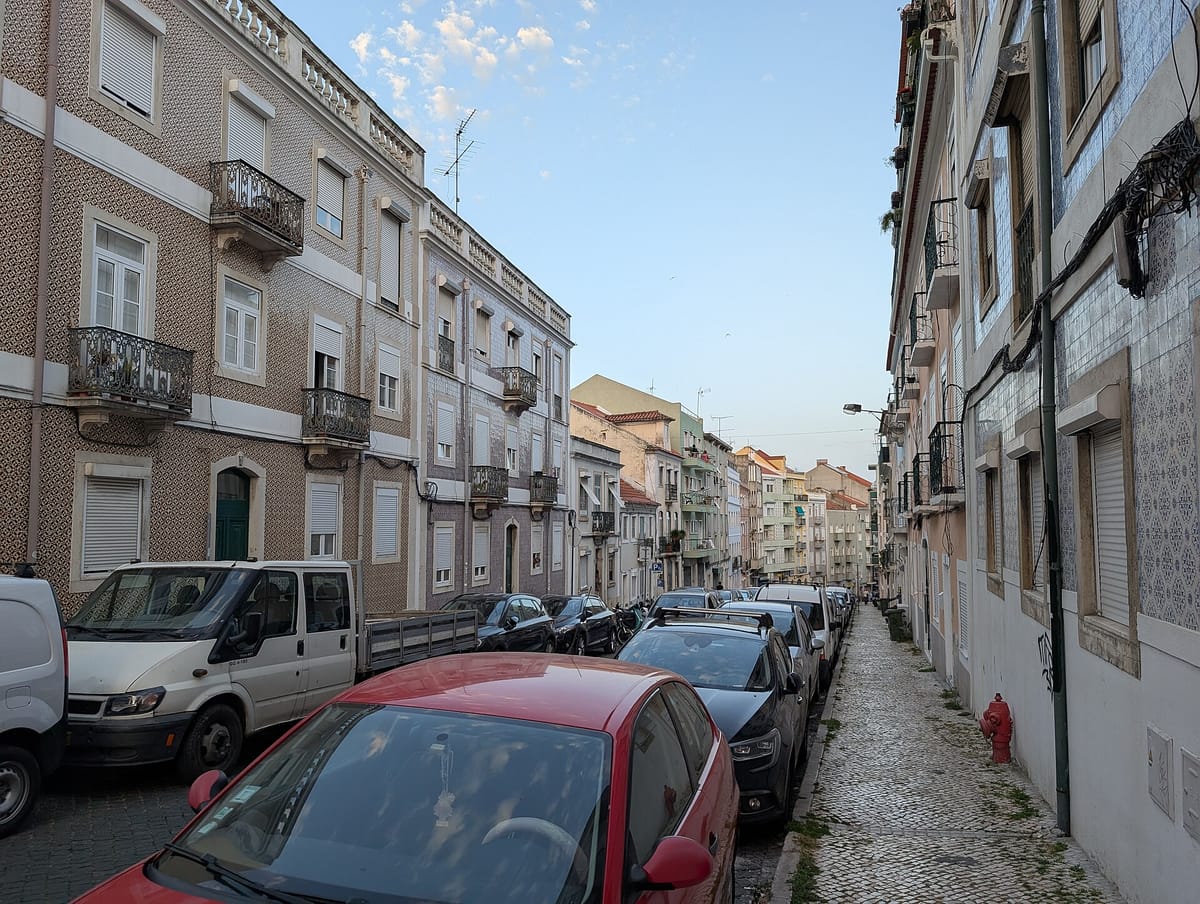
Homes in Portugal cost 16.5 percent more in the second quarter of 2026 than a year earlier, the steepest annual rise of any European Union country with data, according to figures published by Eurostat on 1 October. Across the EU as a whole, house prices rose 4.7 percent over the same period, and in the euro area 4.0 percent.
That puts Portugal's rate at roughly three and a half times the EU average. It is the second quarter in a row that Portugal has led the table, after the first quarter of 2026, when its annual rise of 17.8 percent was also the highest in the Union.
What the figures cover
The House Price Index measures changes in the price of all homes bought by households: flats and houses, new builds and existing properties, whatever their final use. Each country's index is compiled by its national statistics office, which in Portugal is INE (Statistics Portugal), and Eurostat combines them into the EU and euro area aggregates. The figures are not seasonally adjusted.
The Portuguese number matches the 16.5 percent that INE itself reported for the same quarter in September, when its release showed existing homes rising faster than new ones. What the Eurostat release adds is the European comparison.
How Portugal compares
Of the 26 member states with figures for April to June (Greece's data are not available), 23 recorded an annual rise and three a fall. The highest annual increases, according to Eurostat's quarterly house price dataset, were:
- Portugal: 16.5 percent
- Bulgaria: 15.5 percent
- Lithuania: 14.3 percent
- Slovakia: 13.6 percent
- Croatia: 12.7 percent
Spain, Portugal's only land neighbour, recorded 12.1 percent, the same as Romania. At the other end of the scale, prices fell in Finland (by 2.7 percent), Luxembourg (2.2 percent) and France (0.8 percent), while Germany's rose just 0.6 percent.
Hungary, which had overtaken Portugal in the second half of 2025 with annual rises of 21.7 percent and 21.0 percent, has slowed sharply. Its annual rate fell to 14.1 percent in the first quarter and 10.2 percent in the second, and its prices dropped 1.4 percent between the first and second quarters, the largest quarterly fall in the EU.
Still rising, a little more slowly
Portugal's annual rate has now eased for two quarters running: from 18.9 percent in the last quarter of 2025 to 17.8 percent in the first quarter of 2026 and 16.5 percent in the second. The quarterly pace has also edged down, from 4.1 percent in the third quarter of 2025 to 4.0, 3.8 and now 3.6 percent.
Even so, a quarterly rise of 3.6 percent is three times the EU's 1.2 percent and the euro area's 1.1 percent. Only four countries saw faster growth from the first to the second quarter: Lithuania (5.0 percent), Bulgaria (4.5 percent), Romania (4.4 percent) and Latvia (3.9 percent).
Across the EU, the slowdown is broader. The annual rise in the EU fell from 5.1 percent in the first quarter to 4.7 percent in the second, and in the euro area from 4.6 percent to 4.0 percent, according to the release. Eurostat revised the euro area's first-quarter figure down from the 4.7 percent it had published in July.
A decade of faster growth
The longer series shows how far Portuguese prices have pulled away. On Eurostat's index, which sets 2015 at 100, Portugal stood at 301.4 in the second quarter of 2026, meaning prices have roughly tripled in just over ten years. The EU index stood at 168.6, a rise of about 69 percent. Of all member states, only Hungary, at 389.6, has seen a bigger increase since 2015; Lithuania (291.0) and Bulgaria (284.8) follow Portugal.
These are nominal figures: they are not adjusted for inflation or for changes in incomes, so they show how much prices have risen, not how affordable homes are.
What it means if you are buying or renting
- Prices are still climbing faster than anywhere else in the EU. The slowdown since late 2025 is real but small: a home that cost 300,000 euros in the second quarter of 2025 would, at the national average rate, have cost about 349,500 euros a year later.
- The Eurostat figure is a single national average, so it says nothing about how prices are moving in any one city or region.
- The next European comparison is some way off: Eurostat will publish figures for the third quarter of 2026 on 11 January 2027.
Eurostat does not explain the differences between countries in its release.